Non communicable disease like Heart, Cancer, Diabetes diseases are leading global cause of death and are responsible for 70% of deaths worldwide
Chronic diseases are long-term medical conditions that are generally progressive. At present, these are the major causes of disability and death globally.
Medical conditions like heart diseases, cancer, diabetes, hypertension, stroke, asthma and chronic obstructive pulmonary disease (COPD) are lifelong conditions. Therefore, it is important to take charge of your health and manage these conditions to lead a fulfilling life.
Globally, the world is facing an epidemic of chronic disease. Chronic diseases are the number one killer in the world and are responsible for huge individual and societal costs. It is important to assess the health status of people who are living in rural areas with no or very less medical access.


Special examinations exist for many chronic diseases, which can diagnose the disease while it is asymptomatic, with no signs or symptoms. The earlier detection of disease may lead to more cures or longer survival. This possibility has led to public health programs which recommend populations to have periodic screening examinations for detecting specific chronic diseases, for example, cancer, diabetes, cardiovascular disease and so on. Such examination schedules when embedded in a public health program are invariably costly and are ordinarily not chosen on the basis of possible trade-offs in costs and benefits for different screening schedules.
The possible candidate number of examination schedules is so large that it is not feasible to carry out clinical trials to compare different schedules. Instead, this problem can be investigated by developing a unique way by measuring health index of a person by means of stress analysis which can predict the eventual disease specific mortality for different examination schedules.
Chronic diseases are the number one killer in the world
Specialist diagnostics are invariably expensive
Stress analysis is a unique way to measure health index of a person
Benefits of Early diagnosis
Diagnosing early will help to
- Early diagnosis is beneficial both economically and from a healthcare perspective
- An earlier diagnosis can reduce the scale and costs of medication and other interventions, as detection of diseases in their later stages tends to require invasive treatments, which generally incurs greater costs
- Earlier diagnosis helps enable less invasive diagnostic evaluation and treatment, and accelerates the timeline for intervention
- Symptoms might be reversible
- It may be treatable
- Early diagnosis may also improve survival chances for patients, or at least delay the onset of symptoms in order to maximise patient quality of life
- The earlier detection of disease may lead to more cures or longer survival
- Diagnoses are more accurate early in the disease process
- It will helps their family
Heart Rate Variability
Heart Rate Variability (HRV) is the change in time between successive heartbeats also called as R-R interval. Heart rate variability turns out to be a generalized, deep measure of health. That's because higher HRV is a strong indicator of resilience to stress, while low HRV is a sign of reduced capacity to tolerate stress. Low or altered HRV has been found to predict progression of diseases as diverse as cardiovascular disease, cancer, autoimmune disorders, infections, trauma, post-traumatic stress disorder, and depression. The primary source of variability in your heart rate is due to the Autonomic Nervous System (ANS)
ANS is the functional nervous system that controls and regulates the internal organs and hormones. Sympathetic prepare the body for stressful or emergency situations. Parasympathetic is associated with recovery and restores the body. A weak sympathetic system leaves you slow to arouse to action and exhausted. A weak parasympathetic system can leave you hyperactive, overly reactive, and slow to calm down.
How do we measure stress?
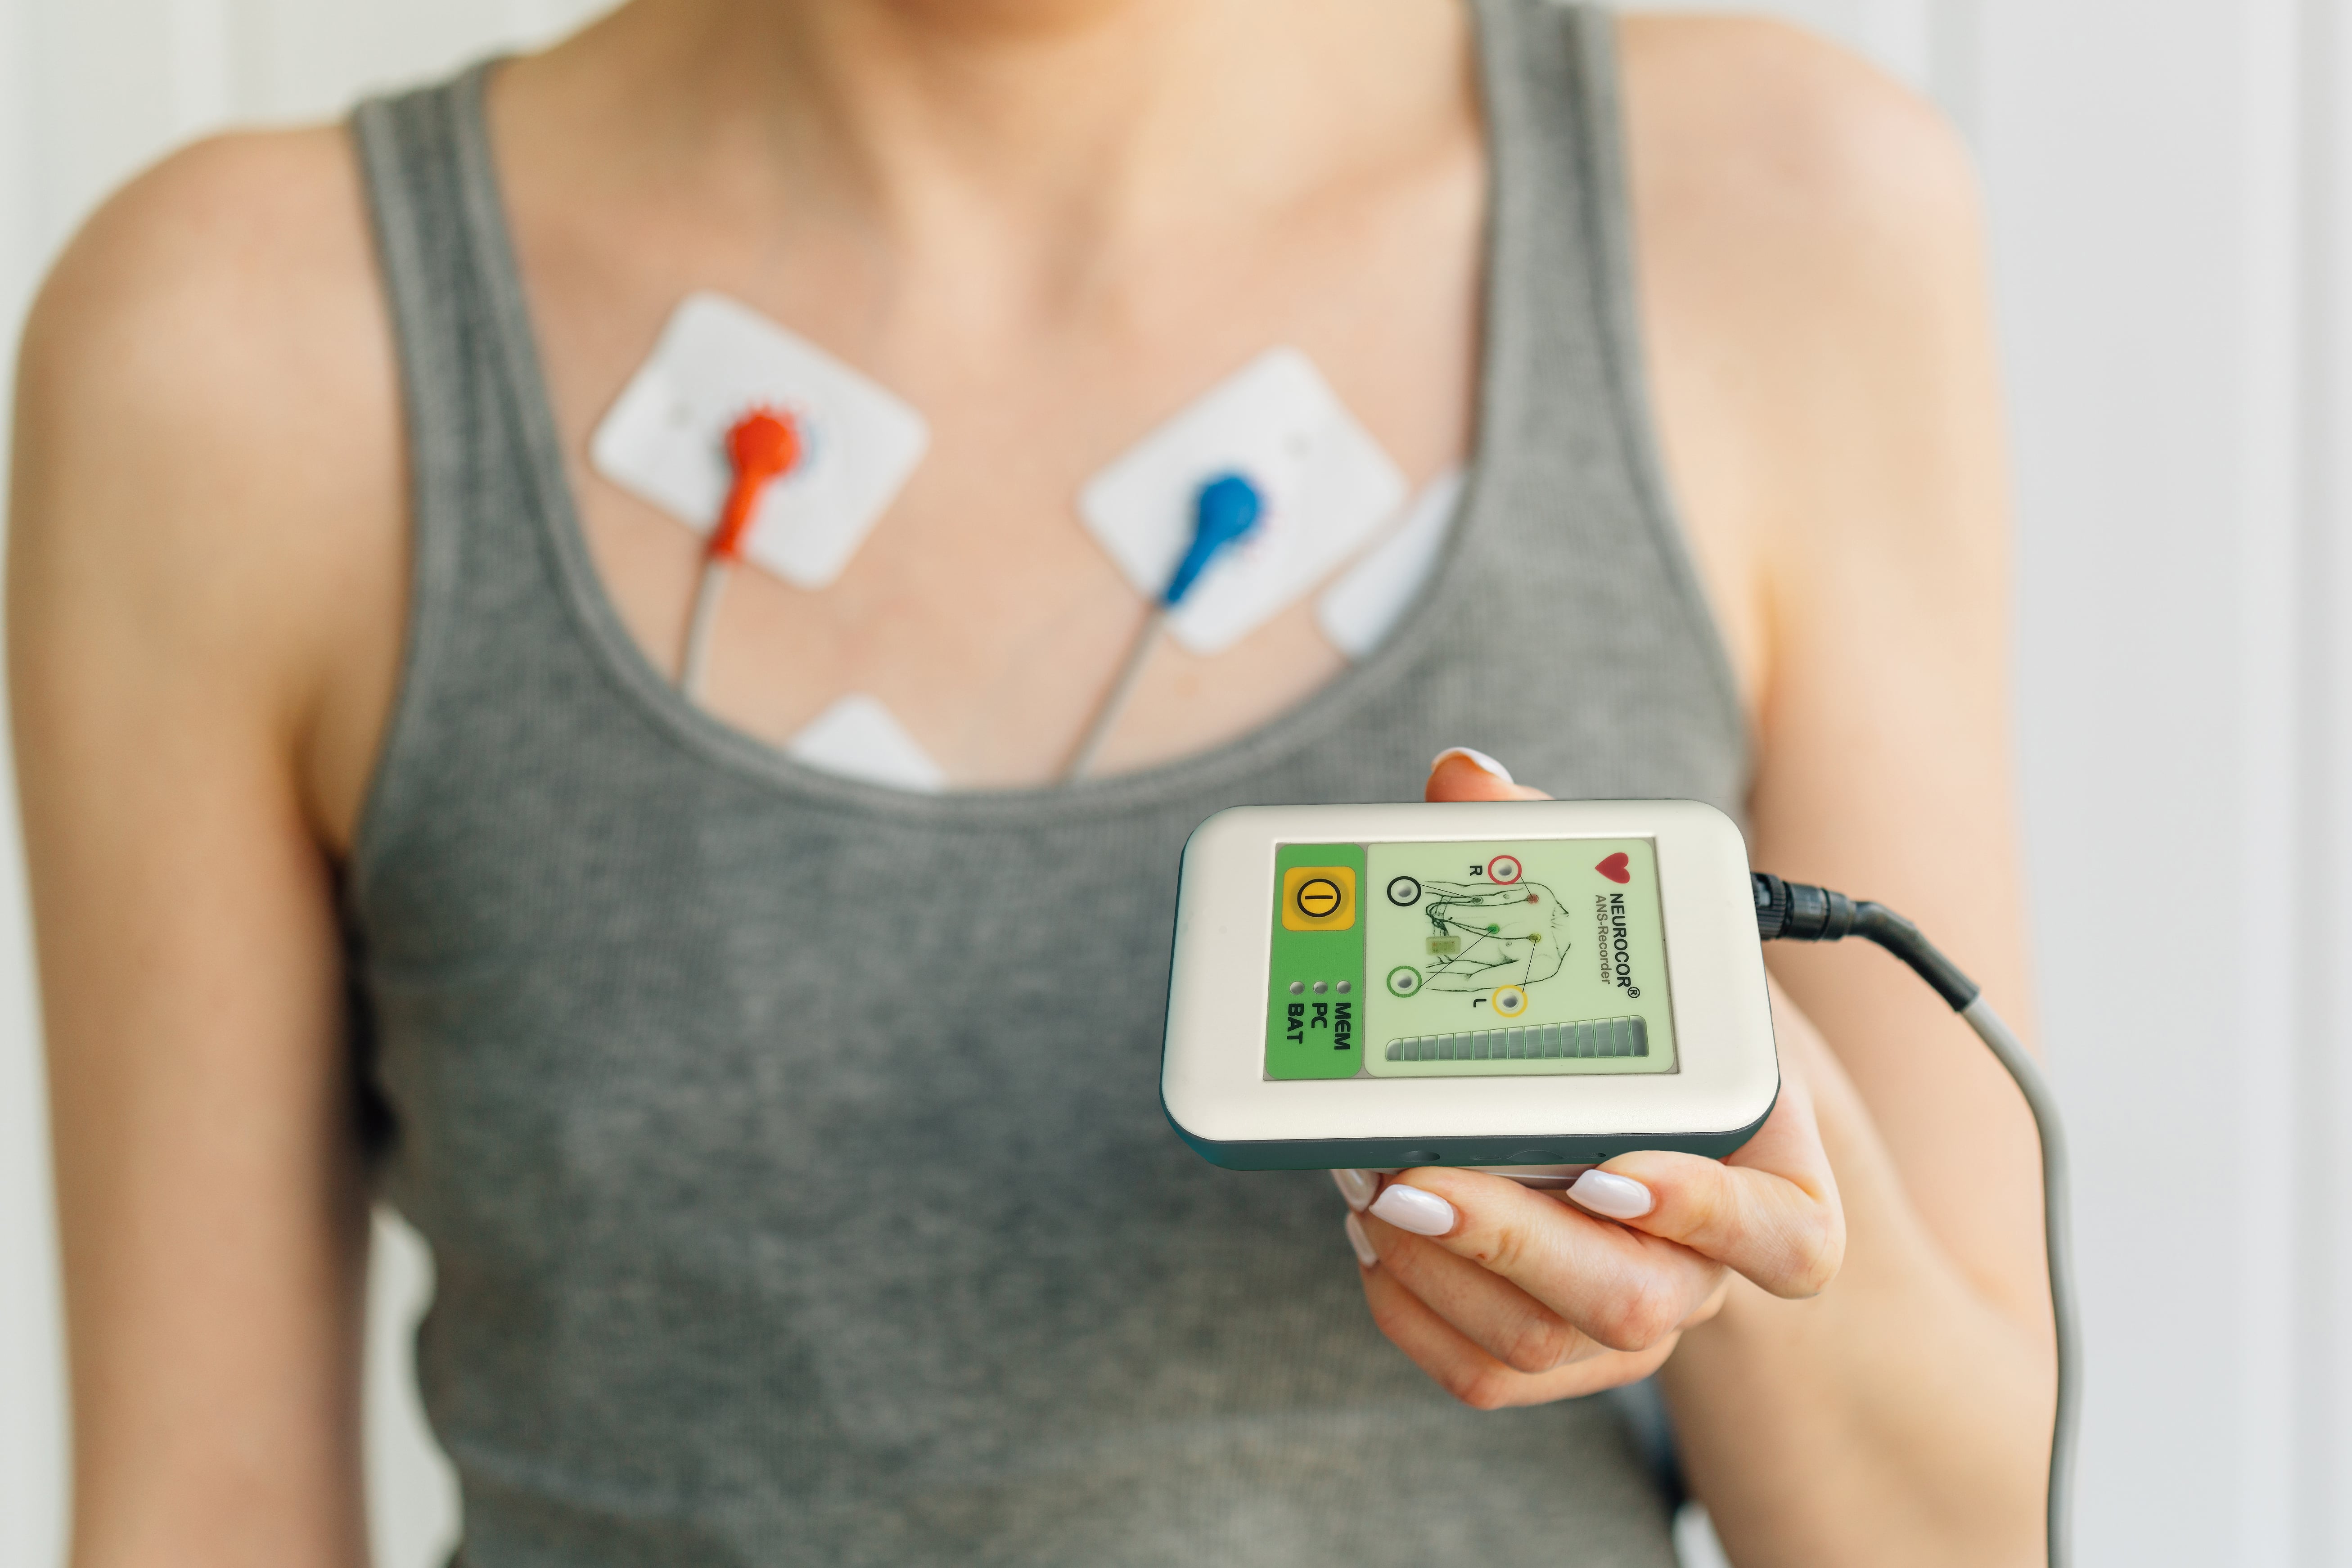
ANS Recorder is a non-invasive powerful, multifunctional, 3-channel, Bluetooth enabled bio-data logger that records the Heart Rate Variability
Hardware is Class-IIa CE certified as per European regulations
Device electrodes are connected to chest and is paired with mobile via Bluetooth. Collected Heart Rhythm data is sent to server where it get analyzed with time and frequency domain analysis which is unique patented highly sensitive algorithm built by Dr. Ralf Arne Wittling
Heart rhythm data is collected from device to mobile via Bluetooth. The recording lasts for 6 minutes and collected data is sent to server for analysis. Data is analysed over the server with complex algorithm which has been developed over the period of 20 years research. 3.8 million Data which is the knowledge base to fine tune the algorithm accurately predict the health condition of a person. It generates the report in following format which can be shared with Patient and Doctors over the mobile.
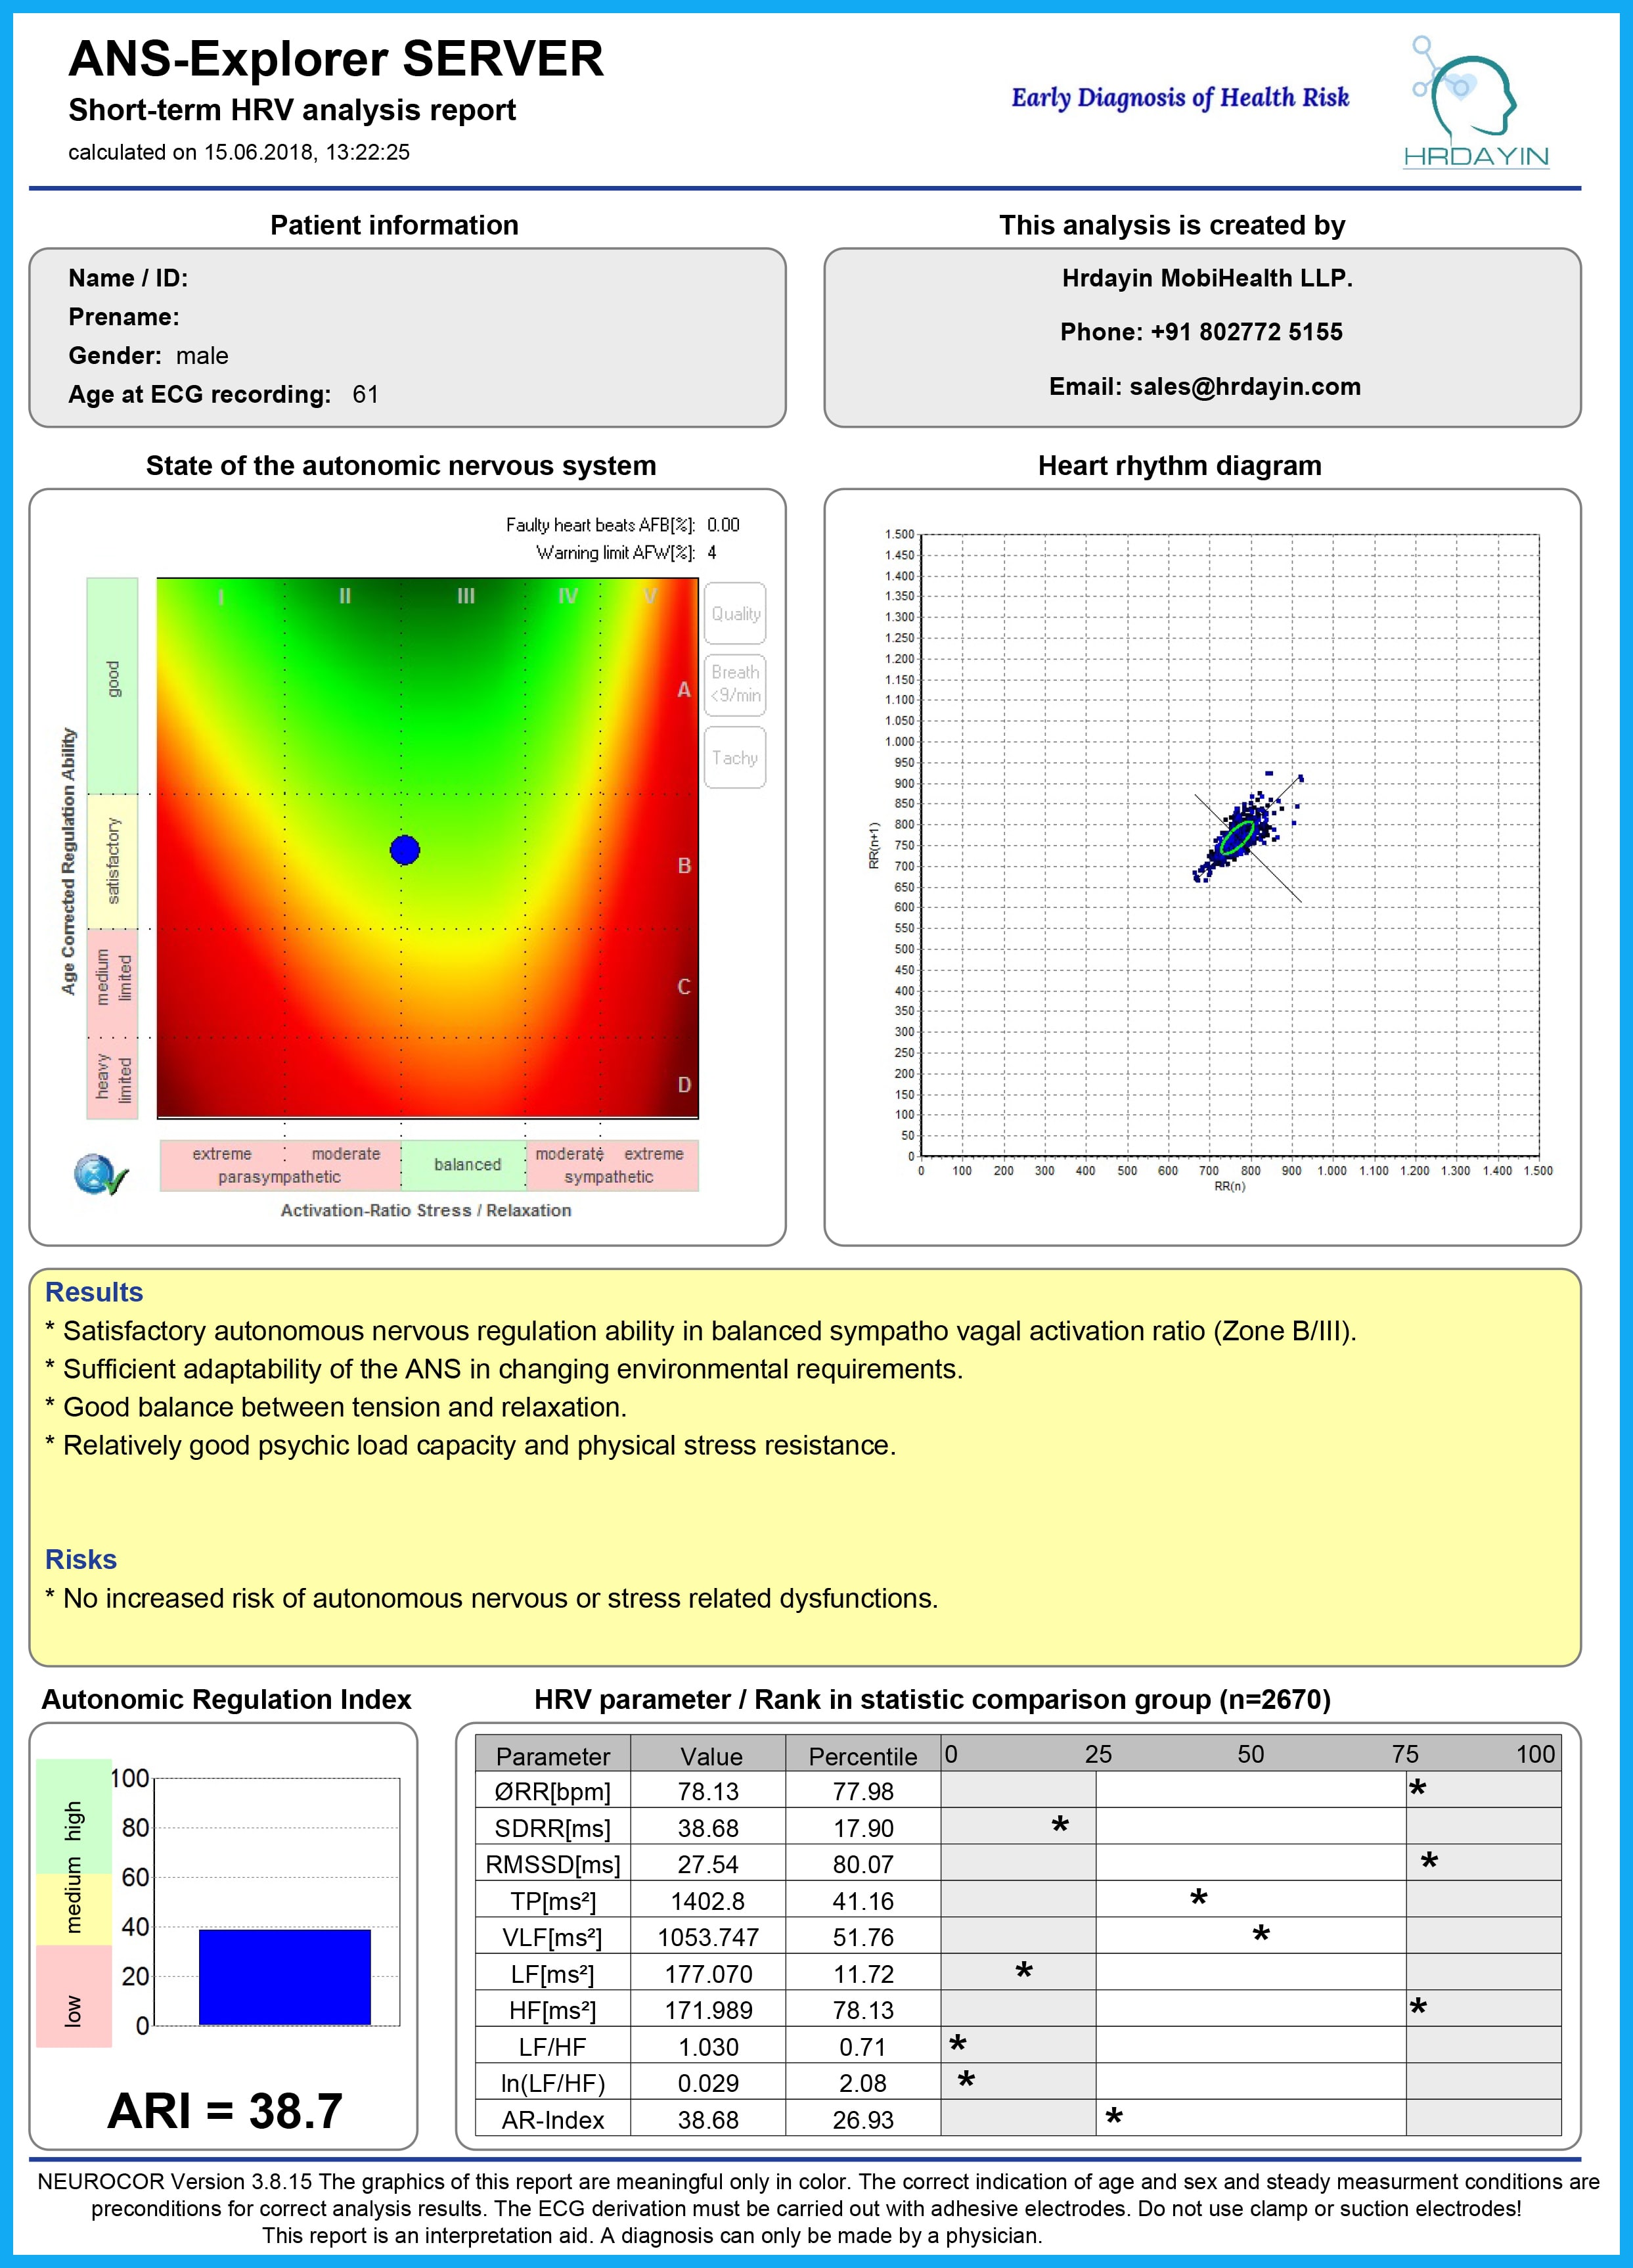
Sample Report
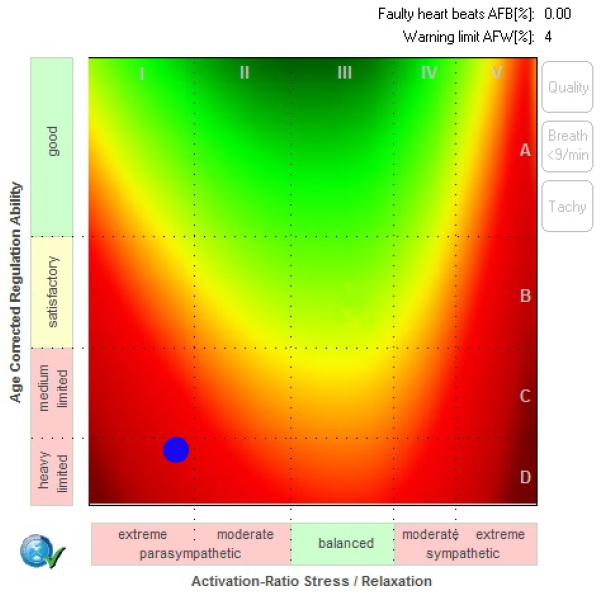
Autonomic regulation level' (Y-axis), sympatho-vagal balance (X-axis)
Area from yellow to green signifies 'good' to 'very good' combine autonomous state respectively
Orange to red marked area signifies 'average' to 'bad' autonomous overall condition
Deep red area, especially the combination of very hard sympathetic activation at the same time very low autonomous-nervous regulation level, needs a detailed medical diagnostics
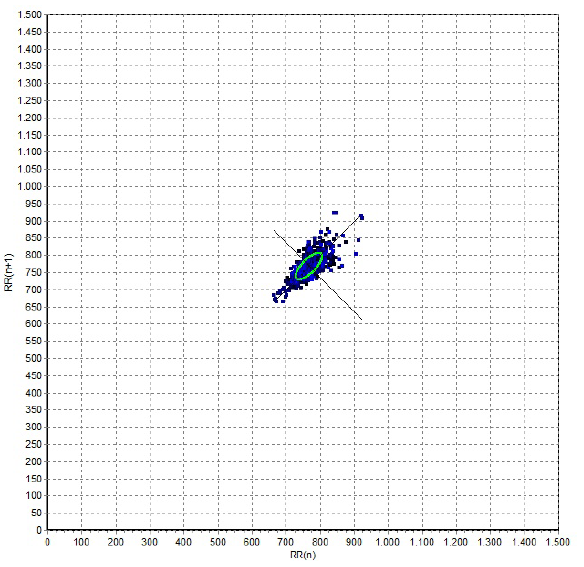
Intuitive understanding of the time distribution of the recorded heart beats. All RR intervals are depicted in two dimensional graph. Abnormal beat pattern can be identified quickly
Certain cardiological diseases are characterized by deviation from the normal distribution form
The autonomous regulations index (ARI) is a parameter, simplified health index of the autonomous nervous system. Low ARI indicates high health risk.
HRV parameters are referred in order to arrive at an optimal finding. Along with these diagrams, detailed text interpretation with proper colour codes are also part of report.

The autonomous regulations index (ARI) is a parameter, simplified health index of the autonomous nervous system. Low ARI indicates high health risk.
HRV parameters are referred in order to arrive at an optimal finding.
Along with these diagrams, detailed text interpretation with proper colour codes are also part of report.
State of Autonomic Nervous System
Area from yellow to green signifies "Good" to "Very Good" combine autonomous state respectively.Orange to red marked area signifies "Average" to "Bad" autonomous overall condition. Deep red area, especially the combination of very hard sympathetic activation at the same time very low autonomous-nervous regulation level, needs a detailed medical diagnostics

Very Good

Average

Extremely Stressed
Completely Burned Out
Heart Rhythm Diagram
Intuitive understanding of the time distribution of the recorded heart beats. Abnormal beat pattern can be identified quickly and Certain cardiological diseases are characterized by deviation from the normal distribution form
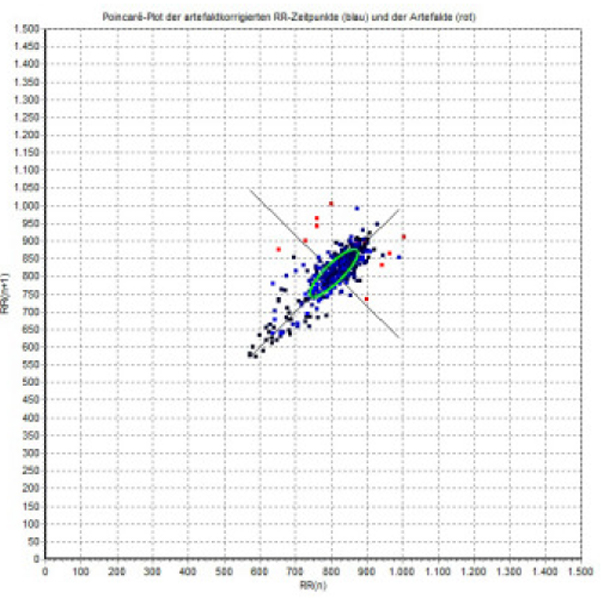
Very Good
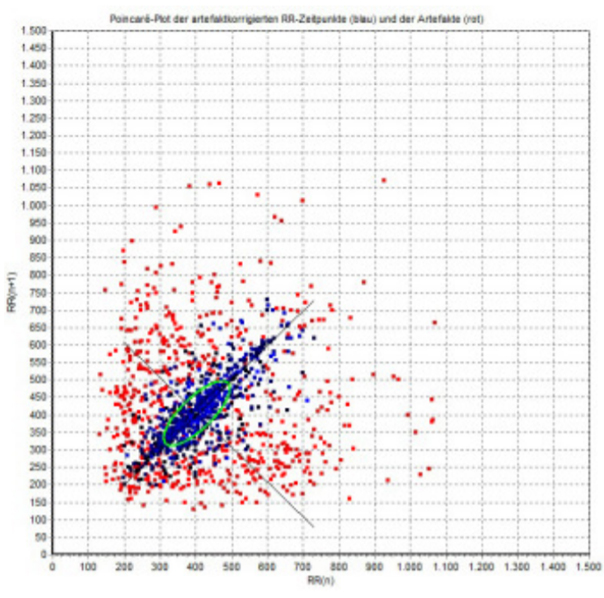
Arrthythmias
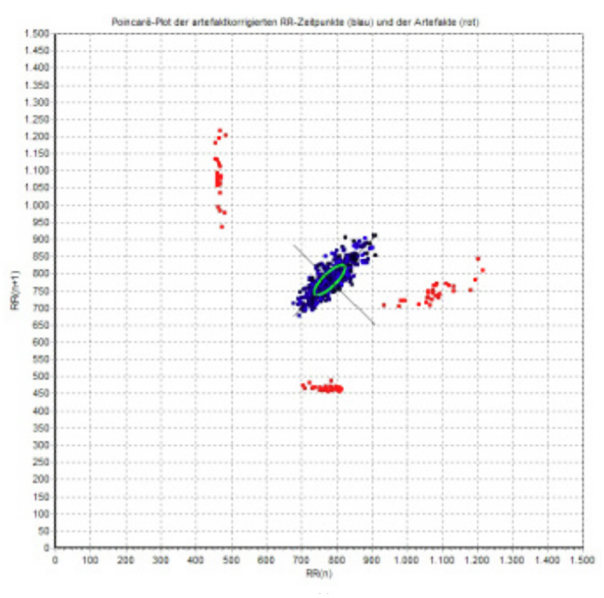
Arrthythmias
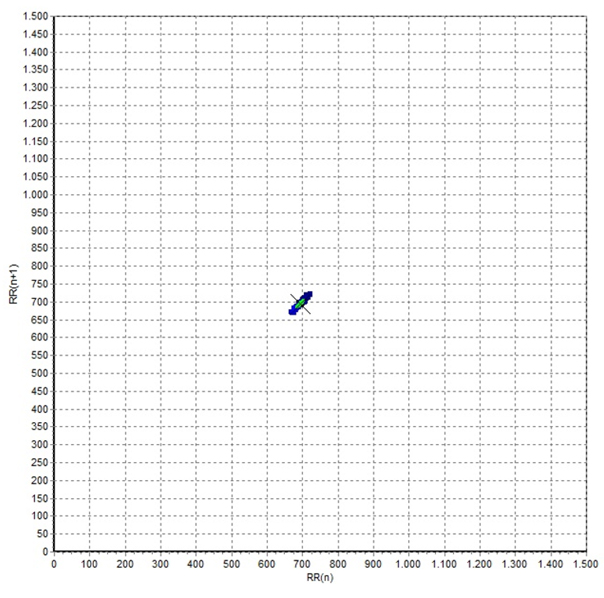
Completely Burned Out
